SportStats olympic dataset analysis and visualization using PowerBi
Business Problem
As a data analyst at a news organization, you are asked to visualize data that will help readers understand how countries have historically performed in the summer Olympic games. You also know that details about the competitors are of interest, so if you come across anything interesting, don't be afraid to bring it up.
The main task is to display historical performance for various countries, with the option of selecting your own country.
Deliverable
Create a visual data story or dashboard in PowerBI for users to examine how their country has historically performed in the Olympics.
Highlight other interesting details about competitors.
Dataset Walktrough
ID – Competitor ID
Name – Competitor’s full name
Sex, Age , Height , Weight – Biodata Information of competitor
NOC – Country Code
Games – Olympic Game Year and season
City – City where game took place
Sport – Type of game played by competitor
Event – Specific Event of sport
Medal – Type of medal awarded to competitor (NA = No medal)
Data Transformation Walkthrough
Renamed ‘Name’ and ‘NOC’ column to ‘Competitor Name’ and ‘Country Abbreviation’
Transformed gender/sex column from ‘M’ and ‘F’ to ‘Male’ and ‘Female’ for better representation.
Created new column called ‘Age_Group’ which specifies if the competitor is either (Under 18, 18-25, 25-30 and over 30)
Renamed ‘NA’ values in Medal column to ‘Not registered’
As per the business requirement, data was filtered to return only summer games.
SQL code for this operation can be found below
SELECT
ID,
Name AS 'Competitor Name',
-- Renamed Column
CASE WHEN Sex = 'M' THEN 'Male' ELSE 'Female' END AS Sex,
-- Better Gender Representation
Age,
CASE WHEN Age < 18 THEN 'Under 18' WHEN Age BETWEEN 18
AND 25 THEN '18-25' WHEN Age BETWEEN 25
AND 30 THEN '25-30' WHEN Age > 30 THEN 'Over 30' END AS Age_Group,
-- Created new age group column
Height,
Weight,
NOC AS 'Country abbreviation',
-- Renamed Column for better comprehension
Games,
Year,
Season,
City,
Sport,
Event,
CASE WHEN Medal = 'NA' THEN 'Not Registered' ELSE Medal END AS Medal
FROM
SportsStats..athlete_events
WHERE
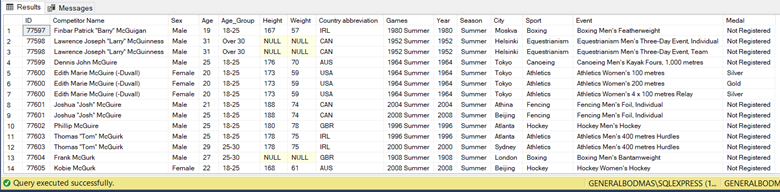
Season = 'Summer'The before and after transformation of the data is shown below ;
Before Transformation
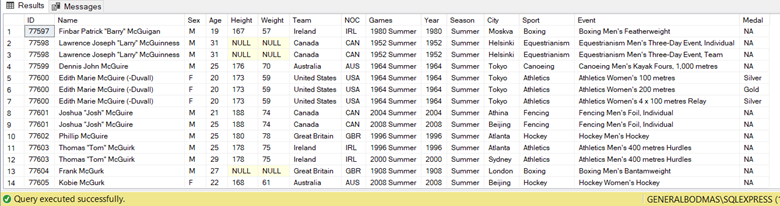
After Transformation
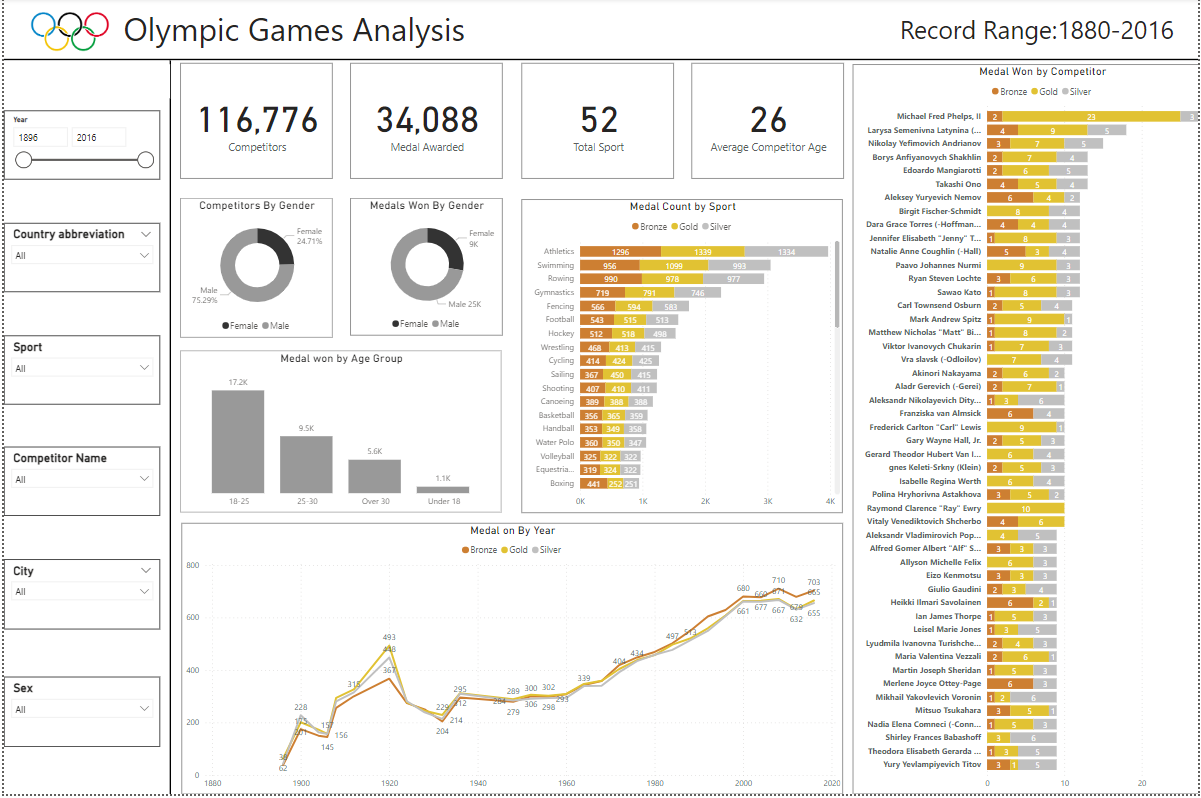
Dashboard
The completed dashboard includes visualizations and filters that allow users to navigate the records data through history. Filtering options include filtering by year, country, sport type, and competitor name.
There are also stacked charts that show how many medals were won in each sport category as well as by individual players or competitors.