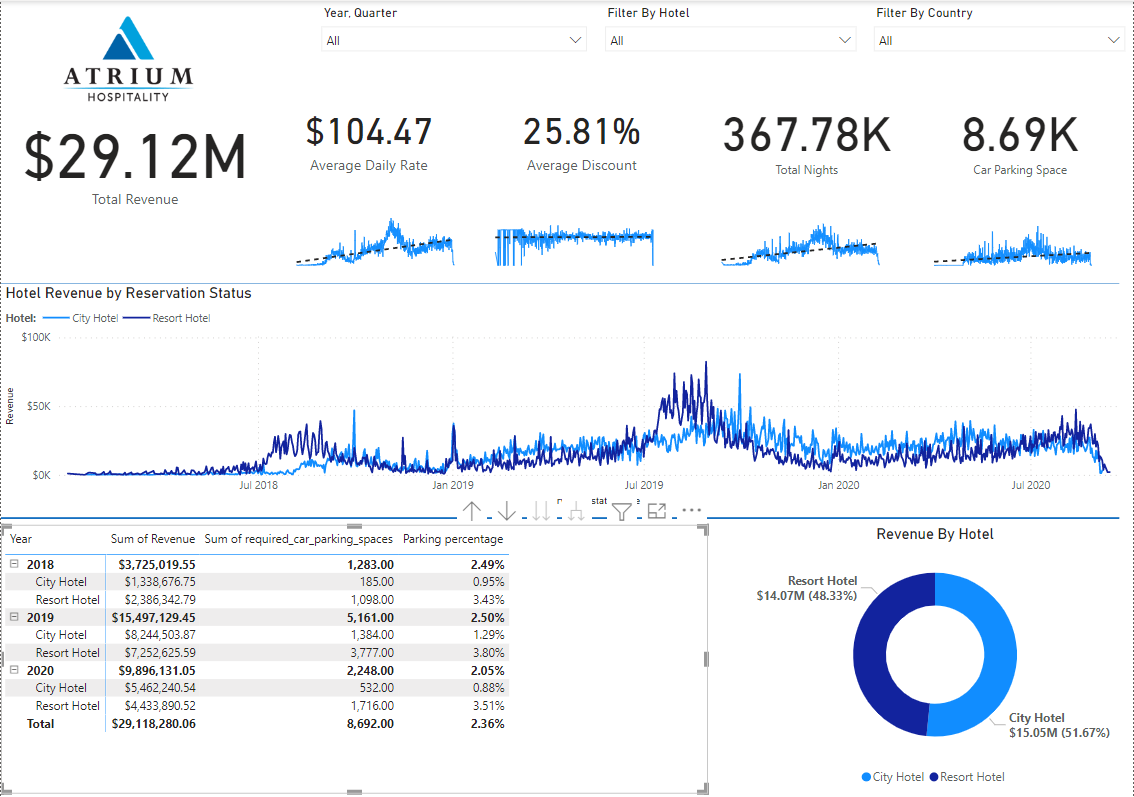
Interactive KPI dashboard of Atrium Hospitality using PowerBI
| Olabode Eso
Goal
Develop a database to Analyze and Visualize Hotel Booking Data
Deliverable
Build a visual data story or dashboard using PowerBi to present to stakeholders
Business Questions
“Is our hotel revenue growing by year?” – We have two hotel types so it will be great to segment revenue by hotel type
“Should we increase our parking lot size” – We want to understand if there is a trend in guests with personal cars
“What trends can we see in the data” - Focus on average daily rate and guests to explore seasonality
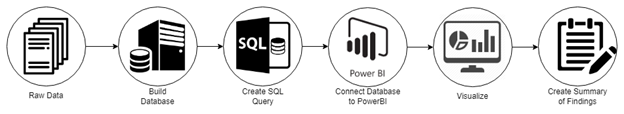
Project Pipeline
Build a database
Develo SQL Query
Connect database to PowerBI
Visualize
Summarize findings