Sales Performance Analysis and Improvment (Python)
Project Objective
The year is 2020, and the stakeholders of G and H have provided us with data from the previous year (12 months). The data contains hundreds of thousands of electronics store purchases broken down by month, product type, cost, purchase address, and so on to create a summary of their performance and product performance, as well as projections and recommendations for the following year.
Deliverable
Create a summary and recommendation report to present to the stakeholders
Possible Questions
What was the best month for sales? and how much was earned that month?
Which city had the highest sales recorded?
What time should we display advertisement to maximize likelyhood of customer buying our product?
Which products are most often sold together?
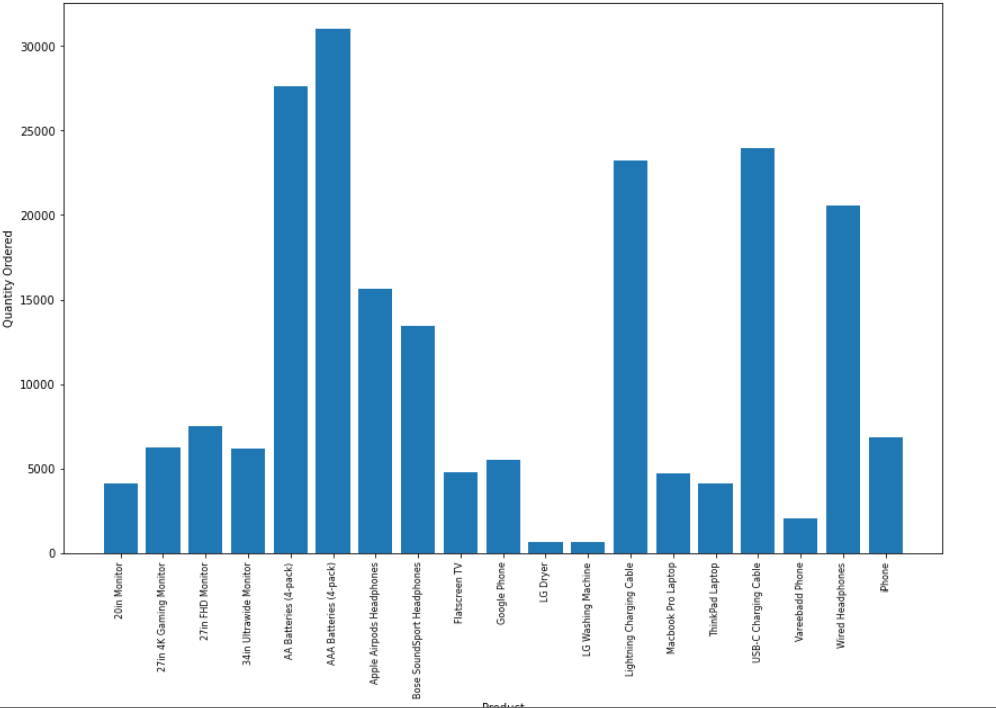
What product sold the most? Why do you think it sold the most?
Tool Used
- Python (pandas, numpy, matplotlib)
Code
The full documentation of the project can be found on GitHub here:
https://github.com/Genbodmas/Analysis-on-Sales-Performance-and-Improvement